Clicking the Grafana tile on the home page lands you on a pre-configured dashboard. It shows the most important values from the attached IDEA-4S sensor at a glance.
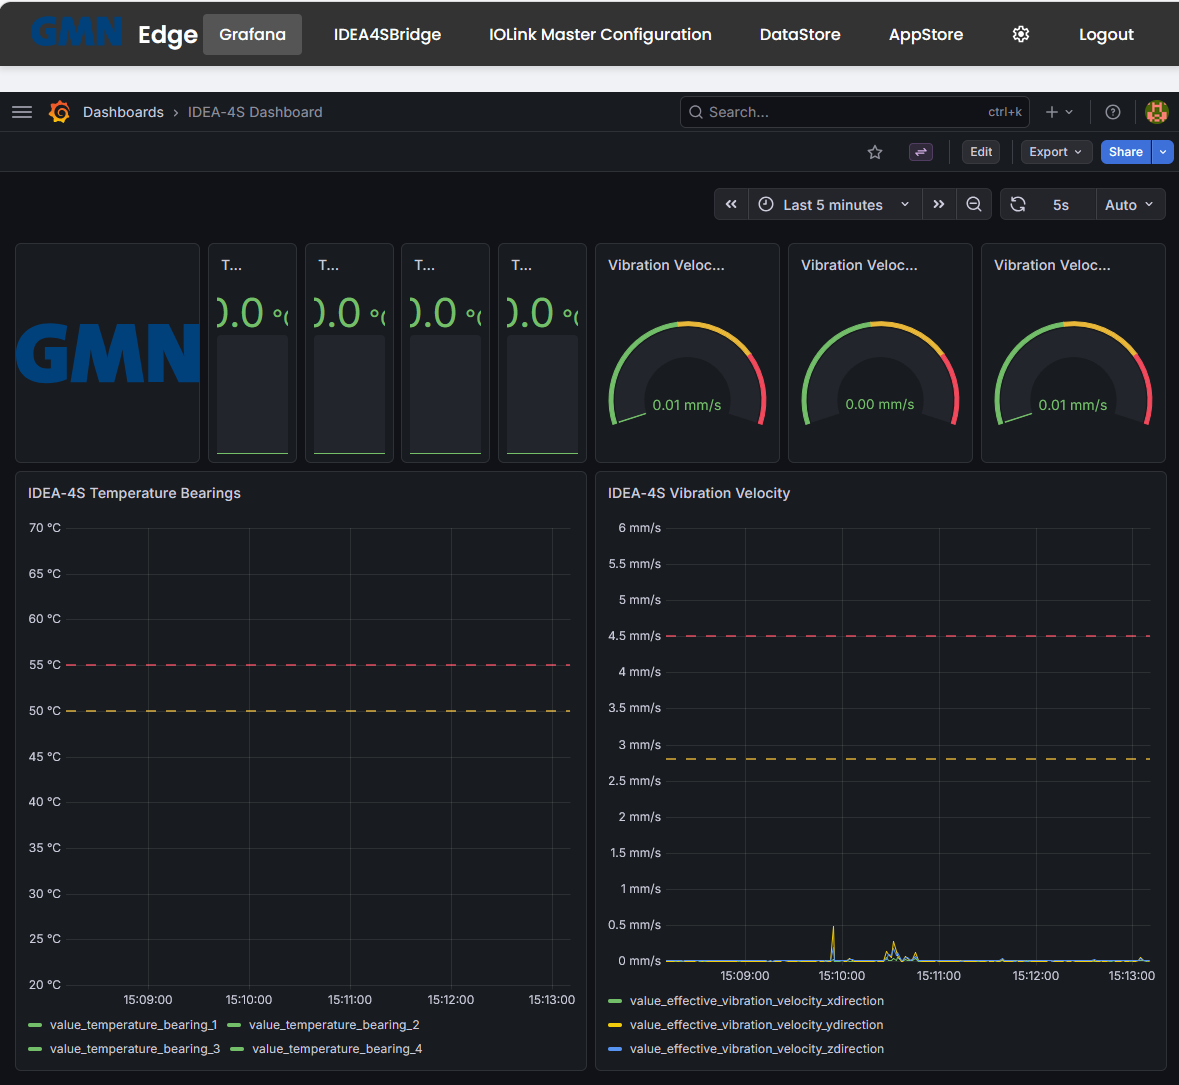
Dashboard layout
- Four bearing-temperature stat tiles top-left: Bearing 1 through Bearing 4, in °C. With live data the tiles colour according to the configured thresholds.
- Three vibration-velocity gauges top-right: X, Y, Z axes, in mm/s. The scale runs green → yellow → red as values approach the IODD-defined thresholds.
- Time-series panel “IDEA-4S Temperature Bearings” bottom-left: all four bearings over the selected time range. The red dashed line is the alarm threshold; the yellow one the fault threshold.
- Time-series panel “IDEA-4S Vibration Velocity” bottom-right: the three axes over the selected time range.
Use the time-range picker top-right (here: “Last 5 minutes”) to switch between live and historical views.
Where does the data come from?
IDEA-4S sensor
    │ (IO-Link, RAW)
    ▼
IFM IO-Link master  ──── publishes via MQTT ──────┐
                                                  ▼
                                       Mosquitto broker
                                              │
                                              ▼
                                          DataStore  ── persists ─→  PostgreSQL
                                              │
                                              ▼
Grafana- The IO-Link master polls the IDEA-4S cyclically and sends each change as an MQTT message. The configured topics are visible in IOLink Master Configuration → Notification.
- DataStore subscribes to these topics, validates them against the schema, and writes the values into the local PostgreSQL on the edge.
- Grafana reads from the PostgreSQL and visualises it. The dashboard ships with the edge; you can clone and customise it.
Signing in: you already are
Grafana has no password of its own. The edge’s control interface signs you in there under your own user name — your name appears top right, and whatever you change is recorded under it. Signing out of the control interface ends your Grafana access with it.
What you may do there follows your role in the control interface:
| Your role | In Grafana |
|---|---|
| Administrator | View, edit and save dashboards |
| User | View dashboards |
If an administrator changes your role, Grafana follows immediately — from your next page load.
Custom dashboards
As an administrator, click Dashboards → New in Grafana’s left sidebar, or duplicate the shipped dashboard, to build your own views. Custom dashboards survive firmware updates — they are not overwritten by the repo seed.
If the save button is missing, you are not signed in to the control interface as an administrator.
When the dashboard stays empty
If you see axes but no data, the data pipeline is usually broken somewhere:
- Open Settings → Diagnosis and check that
datastore,postgres, andmosquittoare green. - Open IOLink Master Configuration → Notification and confirm there is at least one MQTT subscription to
172.16.9.112:1883/teststand/idea-4s(example topic). - If both are OK but Grafana is still empty: this can be a known “memory-loss” case — refer to internal documentation or contact Brinkhaus support.